Cameron Krüger · 4 October 2026
Exploring Graph Visualization Techniques for Mapping Interconnected Ideas in Digital Note Ecosystems
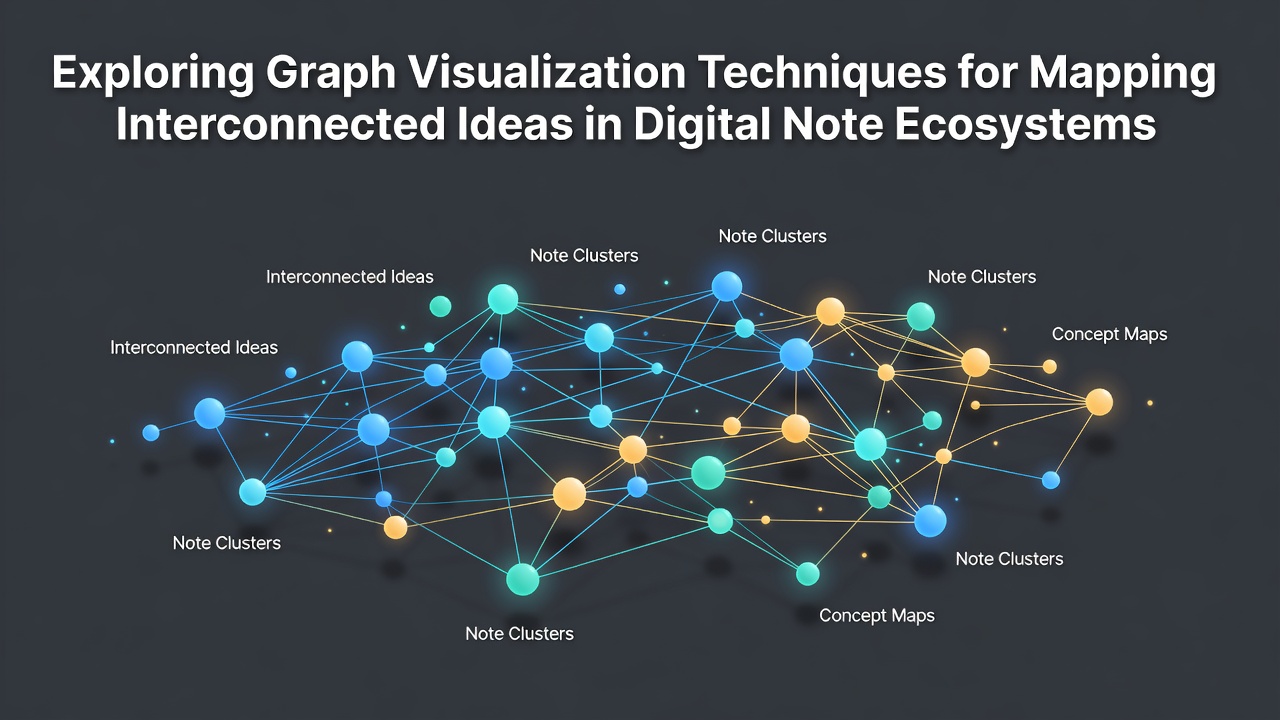
Graph visualization techniques allow users to represent notes as nodes connected by edges that illustrate relationships between concepts, and researchers have documented how these methods support navigation through large collections of digital information. In practice, systems apply force-directed algorithms that position nodes based on connection strength while minimizing visual clutter, and this approach draws from established graph theory principles that date back decades yet continue to evolve with computational advances.
Core Layout Algorithms in Note Mapping
Force-directed layouts remain among the most common because they simulate physical forces to arrange elements automatically, and studies show they help reveal clusters of related ideas without requiring manual positioning. Hierarchical layouts organize notes into tree structures when relationships follow clear parent-child patterns, whereas radial arrangements place central concepts in the middle with connected items radiating outward. Observers note that combining multiple layout types within one interface gives users flexibility to switch views depending on the density of connections.
Data indicates that interactive features such as zooming, panning, and filtering improve usability when graphs grow beyond a few hundred nodes, and October 2026 conferences on information visualization highlighted new rendering engines that maintain smooth performance even with thousands of interconnected entries. Those who've implemented these techniques report that edge bundling reduces visual noise by grouping parallel links, while node sizing based on connection count draws attention to heavily referenced notes.
Integration with Digital Note Platforms
Modern note ecosystems incorporate graph views directly into daily workflows, and this integration allows bidirectional links created during writing to appear instantly as visual edges. Researchers discovered that color-coding nodes by tags or metadata categories adds another layer of information without separate legends in many cases. People often find that temporal filtering, which highlights notes added within specific date ranges, reveals how idea networks develop over months or years.
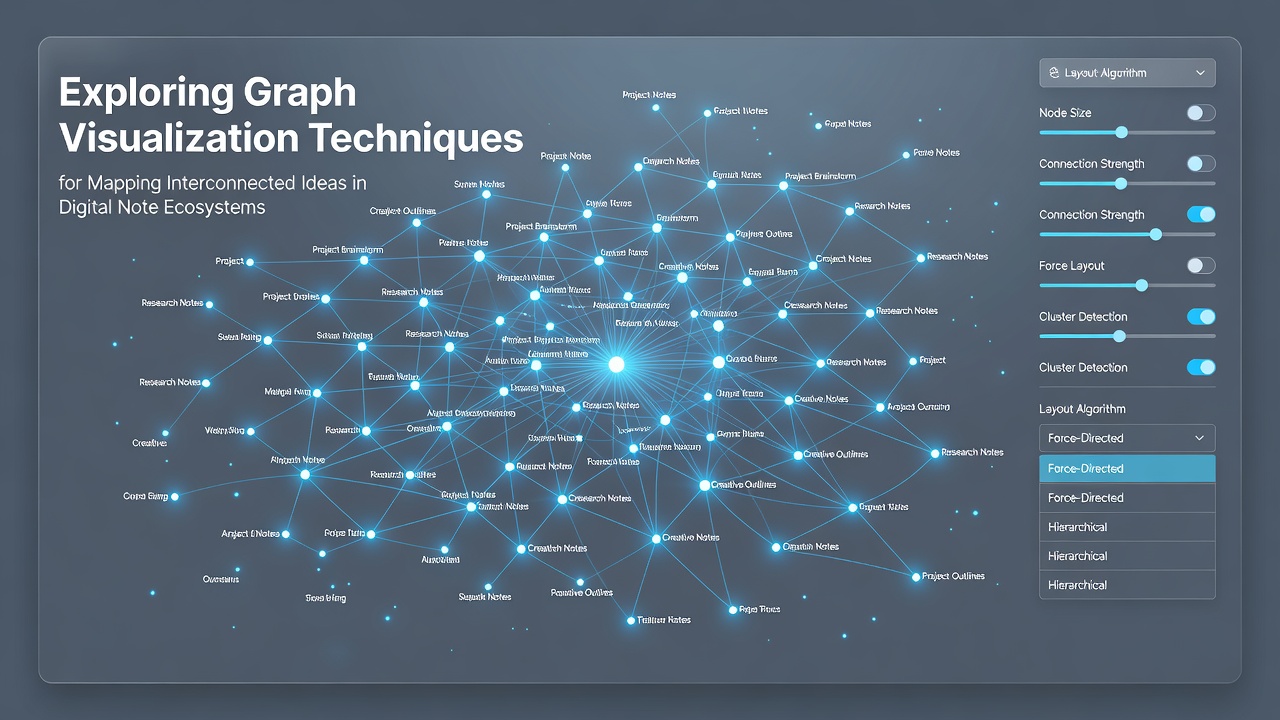
What's interesting is how collision detection algorithms prevent overlapping text labels during dynamic rearrangements, and evidence suggests these refinements come from broader advances in computer graphics rather than note-specific development alone. Academic sources such as those at the MIT Computer Science and Artificial Intelligence Laboratory have contributed algorithms that balance aesthetic clarity with computational efficiency, while parallel work at Australian institutions explores accessibility adaptations for users with visual impairments.
Performance Considerations and Scalability
Large note collections demand optimized data structures because rendering every connection simultaneously can strain browser resources, and developers address this through level-of-detail rendering that simplifies distant parts of the graph. Studies found that precomputing layout positions in the background keeps interactions responsive, and this technique proves especially useful when users add or remove links frequently. Figures from industry reports reveal steady growth in the adoption of WebGL-based rendering for these visualizations since it leverages GPU acceleration available on most modern devices.
Yet maintaining readability requires careful handling of edge crossings and label placement, and algorithms continue to improve through iterative testing against real user datasets. One study revealed that users complete relationship-finding tasks faster with well-tuned force-directed graphs compared to list-based navigation alone, although results vary with the complexity of the underlying note structure.
Emerging Approaches and Tooling
Recent developments include machine learning models that suggest additional connections based on content similarity, and these suggestions appear as dashed edges until users confirm them. Canadian research groups have examined how semantic embeddings can influence initial graph layouts to surface latent themes, while European visualization labs focus on comparative views that display multiple graph snapshots side by side. The reality is that open standards for exporting and importing graph data now allow interoperability between different note applications.
Those who've studied this area know that performance benchmarks published in peer-reviewed venues provide concrete guidance on choosing layouts for particular dataset sizes. And techniques such as fisheye distortion let users magnify areas of interest while preserving context, which proves valuable during exploratory sessions that span hundreds of notes.
Conclusion
Graph visualization continues to mature as a practical method for revealing structure within digital note collections, and ongoing research supplies both refined algorithms and empirical data on their effectiveness. Integration of these techniques into everyday tools has expanded access, while performance optimizations keep larger ecosystems manageable. Observers note that future progress will likely depend on closer collaboration between visualization specialists and developers of note platforms, resulting in interfaces that adapt layouts automatically to individual collection characteristics.